A Journey of Discovery

Scroll to begin
Evidence board of scanned WAMEX reports and hand-drawn geological maps
Where it starts

The mess we started with

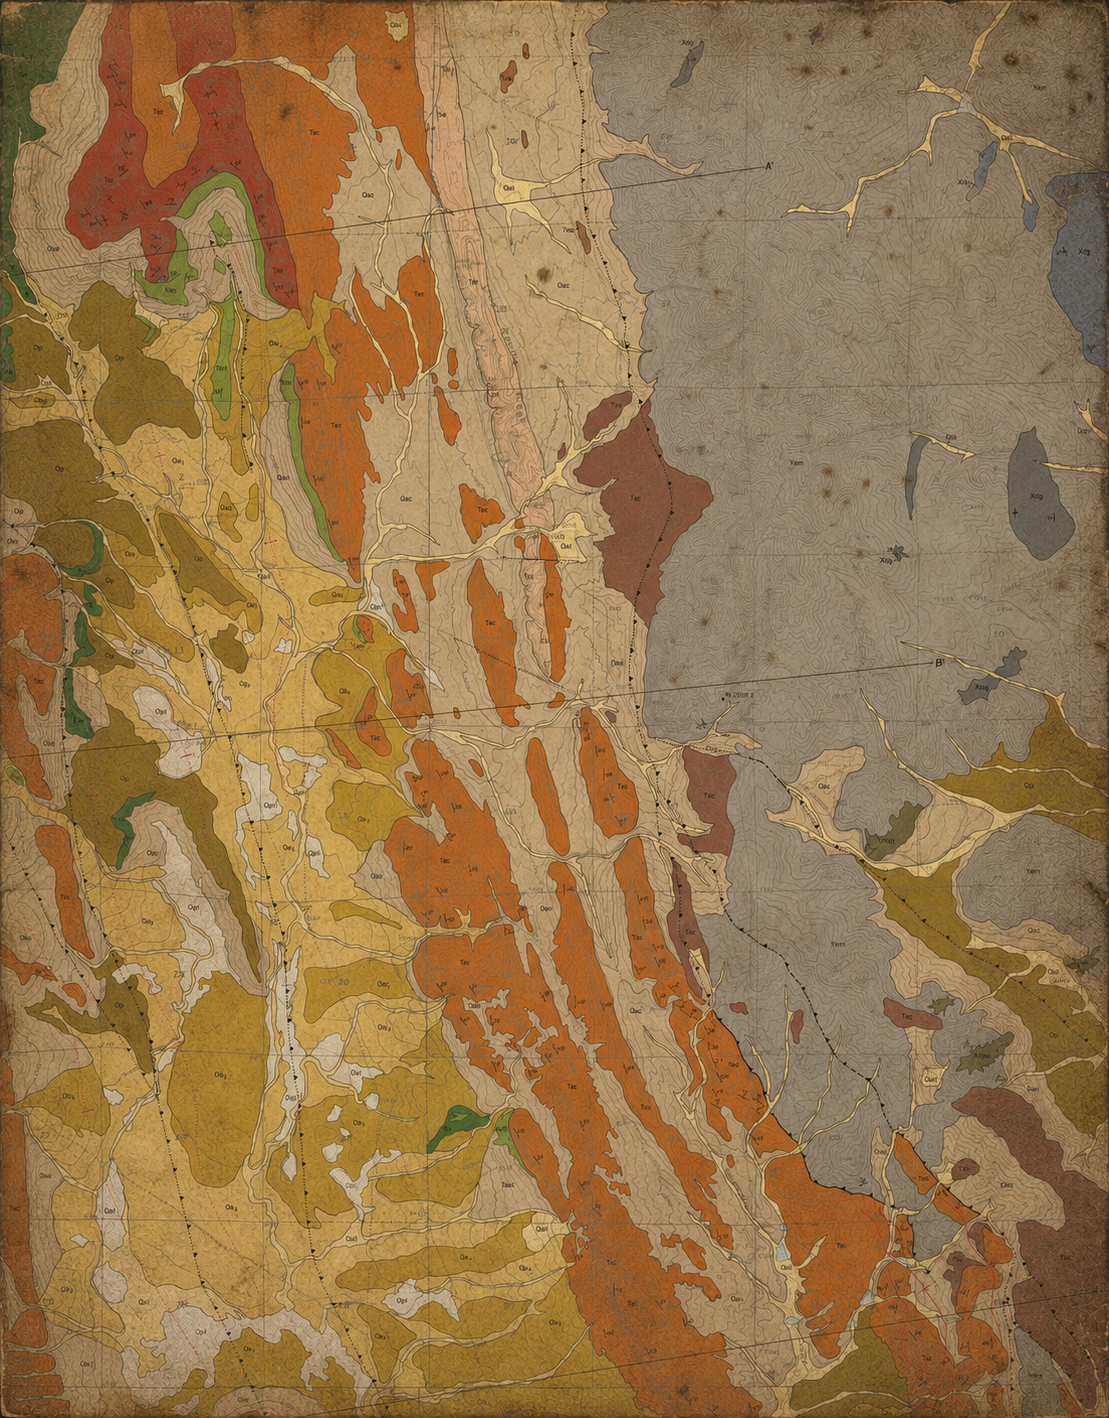
In many parts of the world mineral discovery is difficult due to a lack of information. Not data. There’s plenty of data, but it’s in hard-to-access historical formats. Typed and badly scanned reports, faded hand-drawn maps, obscure data formats.

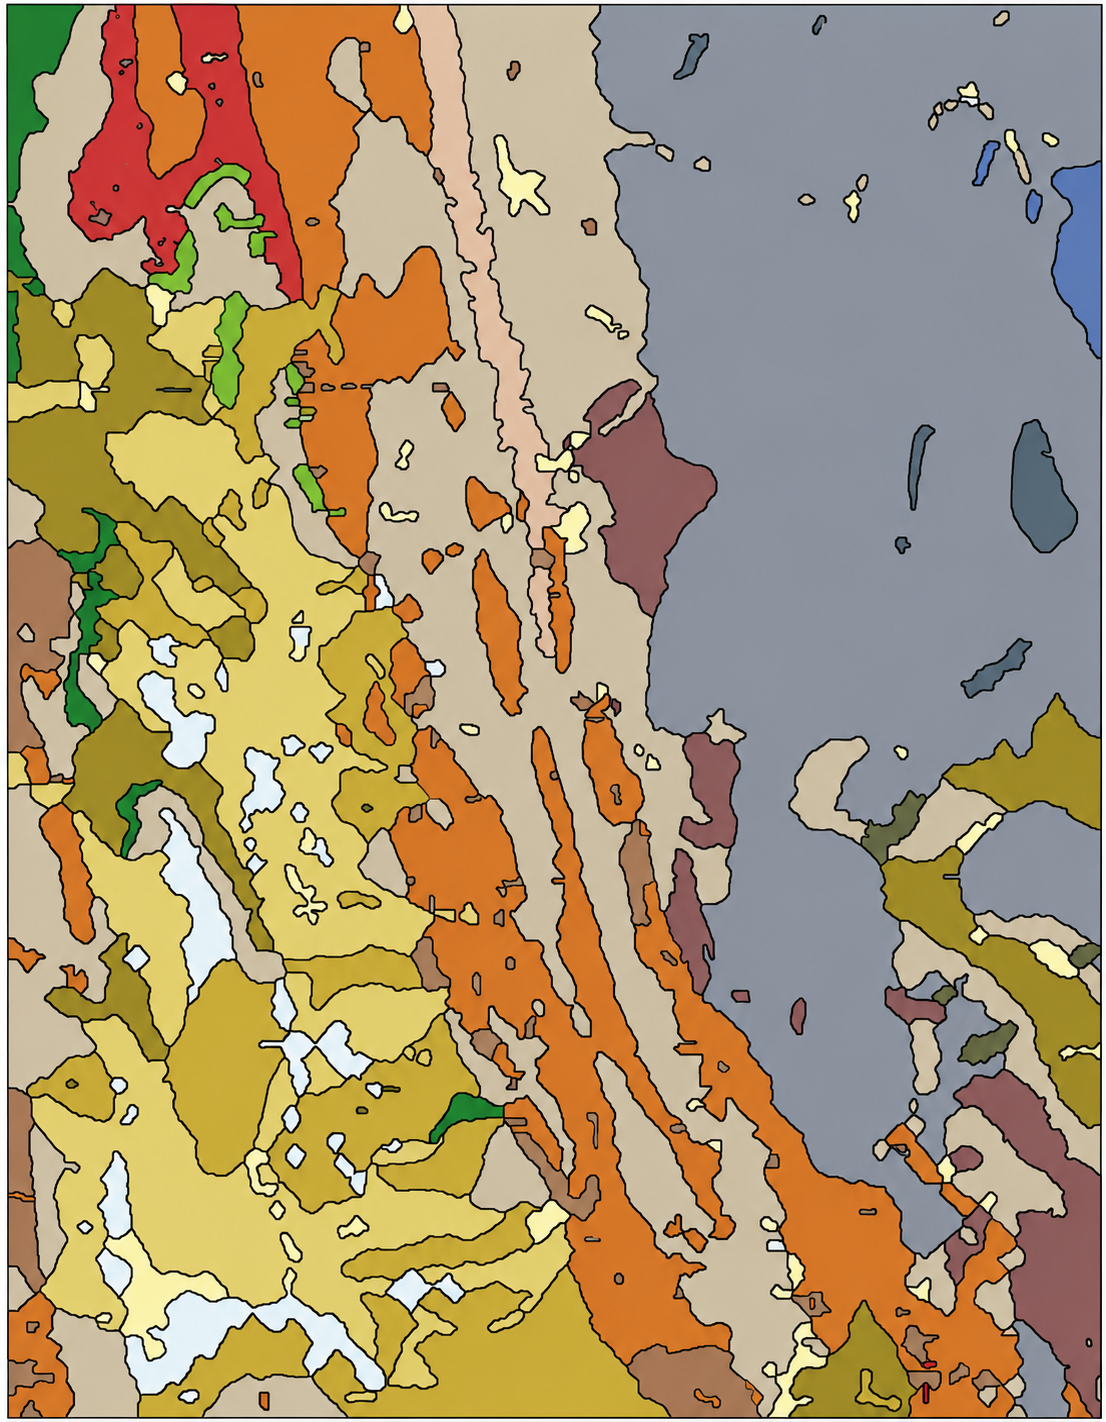
Original geological survey mapClassified lithology polygons
Stage one

From scans to structured data

We specialise in extracting clean information from noisy data. Our specialised models convert messy analogue data into clean computer-readable file-structures.

  • Georeferencing: automated pixel-to-location mapping
  • Lithology polygons: patterns compared with legends to classify rock-unit groups
  • Feature extraction: detection of key features (boreholes, samples, surveys)
3D voxel belief map
The belief map

A 3D model of what’s underground

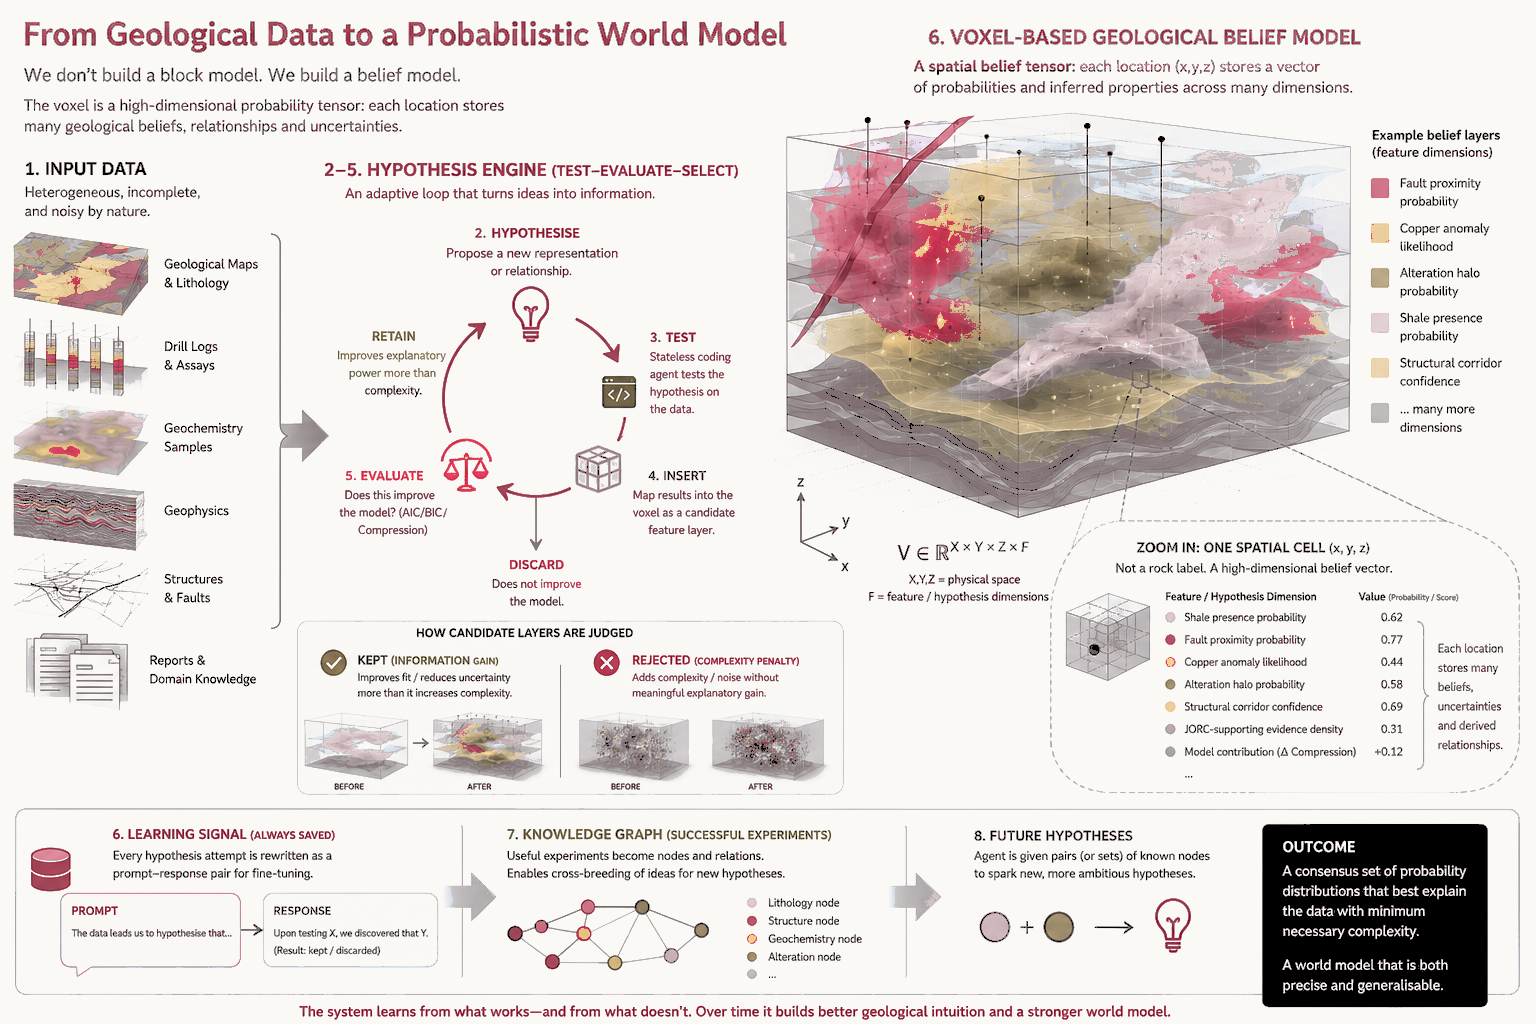
We then give the newly legible data to a self-learning AI model. It uses custom information-theoretic measures to systematically evaluate hundreds or thousands of relationships. Those that improve the overall model of the area-of-interest are retained and quantified; those that don’t are dropped.

What you’re looking at is a voxel belief map: the ground under this gold field, divided into cells. Each cell holds the model’s belief about what’s down there — brighter means stronger evidence, and the depth axis is real.

Unlike most AI outputs, these are white-box features: you can review the code and have your Qualified Person check the results.

Open the 3D viewer ↗
From geological data to a probabilistic world model — the voxel belief-model pipeline
The pipeline
Click to enlarge
Scroll to continue
Interactive prospectivity map
Prospectivity

Which evidence actually matters

Over time your custom model learns about your area of interest just as a human researcher would, building up an ever more precise feature map. This lets us map sparse features — like ore bodies — to dense ones — like lithology, creating an uncertainty-aware, white-box prospectivity map.

Every layer has to earn its place. The badge next to each one is its uncertainty reduction: green means adding the layer makes the model measurably better; red means it doesn’t. Try toggling them.

Open the full map →
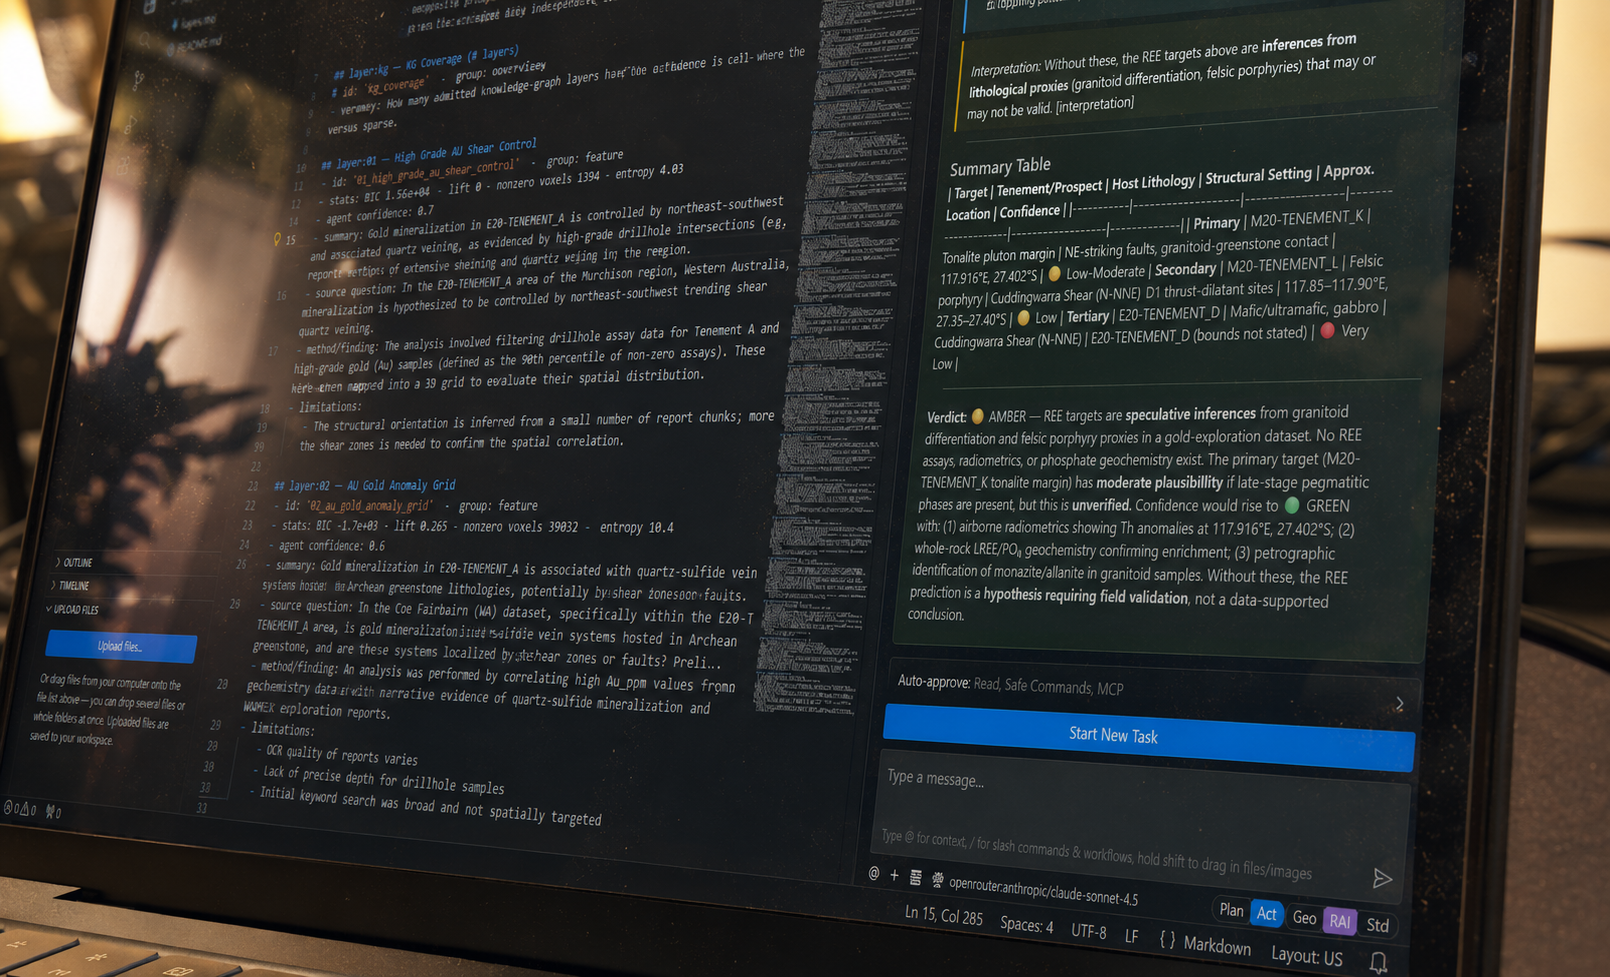
The AI assessing rare-earth targets in the Coe Fairbairn dataset, with summary table and verdict
The reveal

It found what the humans hadn’t. Yet.

The graphics you have seen come from an established gold mining area in which an economically significant rare earth deposit was discovered in 2021. Our model easily spotted the rare earths with only pre-2020 data to work on.

Click image to read
← eigenform.aiSkip the tour → open the map